Your mini app automatically tracks when it is started by students. You can additionally tell your AI assistant to build in other metrics – these are called telemetry. Then, you can use natural language to query these records to understand how students are engaging with your mini app.
For example, you may want to track which answers your students are getting incorrect, or which choices they are making, or how many times they click on a particular option.
Adding telemetry #
As with the build of your mini app itself, the AI builder will add telemetry for you based on what you tell it.
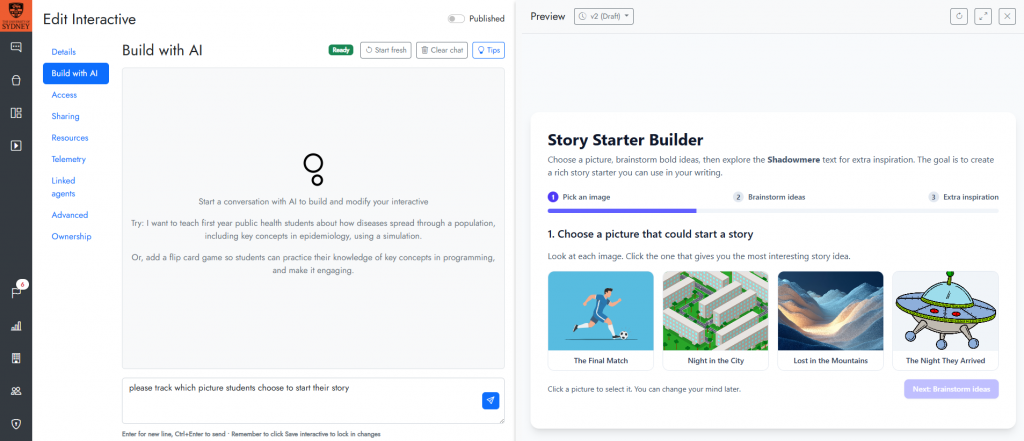
In the Build with AI tab, tell the AI builder what you would like to ‘track‘. In the example below, we are asking, “please track which picture students choose to start their story“.
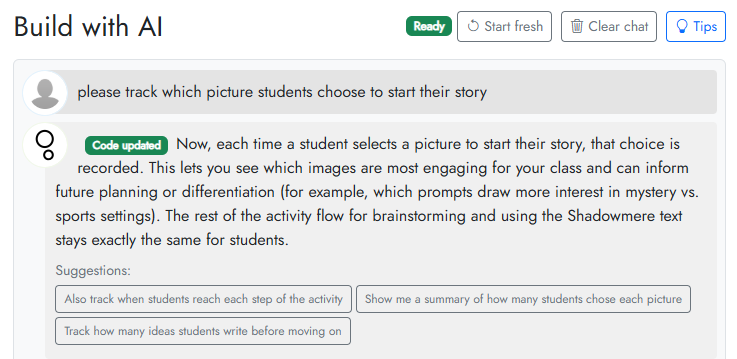
The AI builder will modify the code of your mini app for you. You do not need to do any coding. For example, it may respond saying that it has updated the mini app:
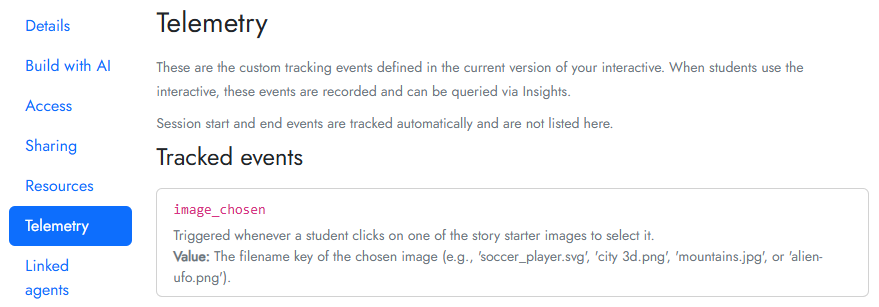
You can see the events or details that your Interactive is tracking by clicking on the Telemetry tab. For example, the above request added the ‘image_chosen’ telemetry event to this mini app:
Make sure you save your mini app by clicking Save interactive.
Collecting telemetry #
Once telemetry has been added to your mini app, collection is automatic. However, telemetry capture is automatically disabled if you are previewing your mini app in the preview panel in build mode. To actually send telemetry events, your mini app needs to be viewed standalone. You can do this by clicking on the Access tab and using the link, or you can load your mini app in your LMS as an LTI plugin.
Analysing telemetry #
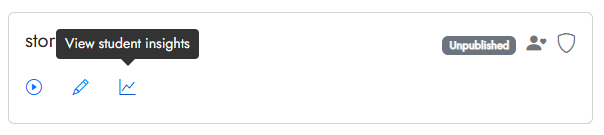
From the Interactive Mini Apps list, click View student insights.
Cogniti will pre-analyse the telemetry that is has, and suggest some examples of queries you might ask.
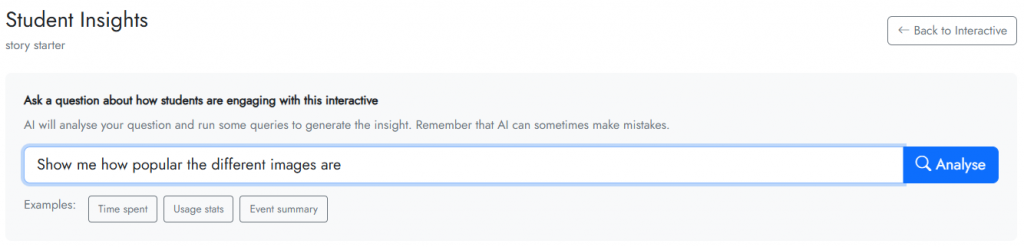
Enter your query into the query box, in plain language. For example, “Show me how popular the different images are”. Click Analyse.
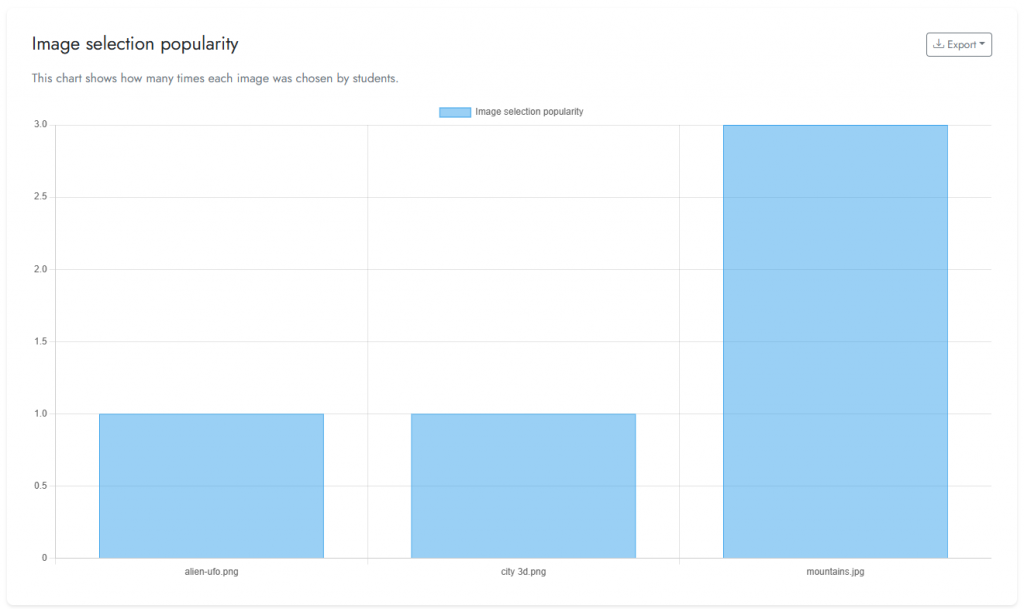
Cogniti will then take your query, interpret it, search through the available telemetry data, and produce an analysis. For example, here is a chart it produces showing how popular the different images are:
Depending on the analysis, you can usually export the data using the Export button.


